Latency, loss and jitter
Track latency and packet loss over time, with the min/max and jitter context that a single average hides.
Distributed network monitoring
Endpoint latency is only part of the story. See latency and packet loss along the whole route, from across the internet to inside your own network.
Built by network engineers, for network engineers.
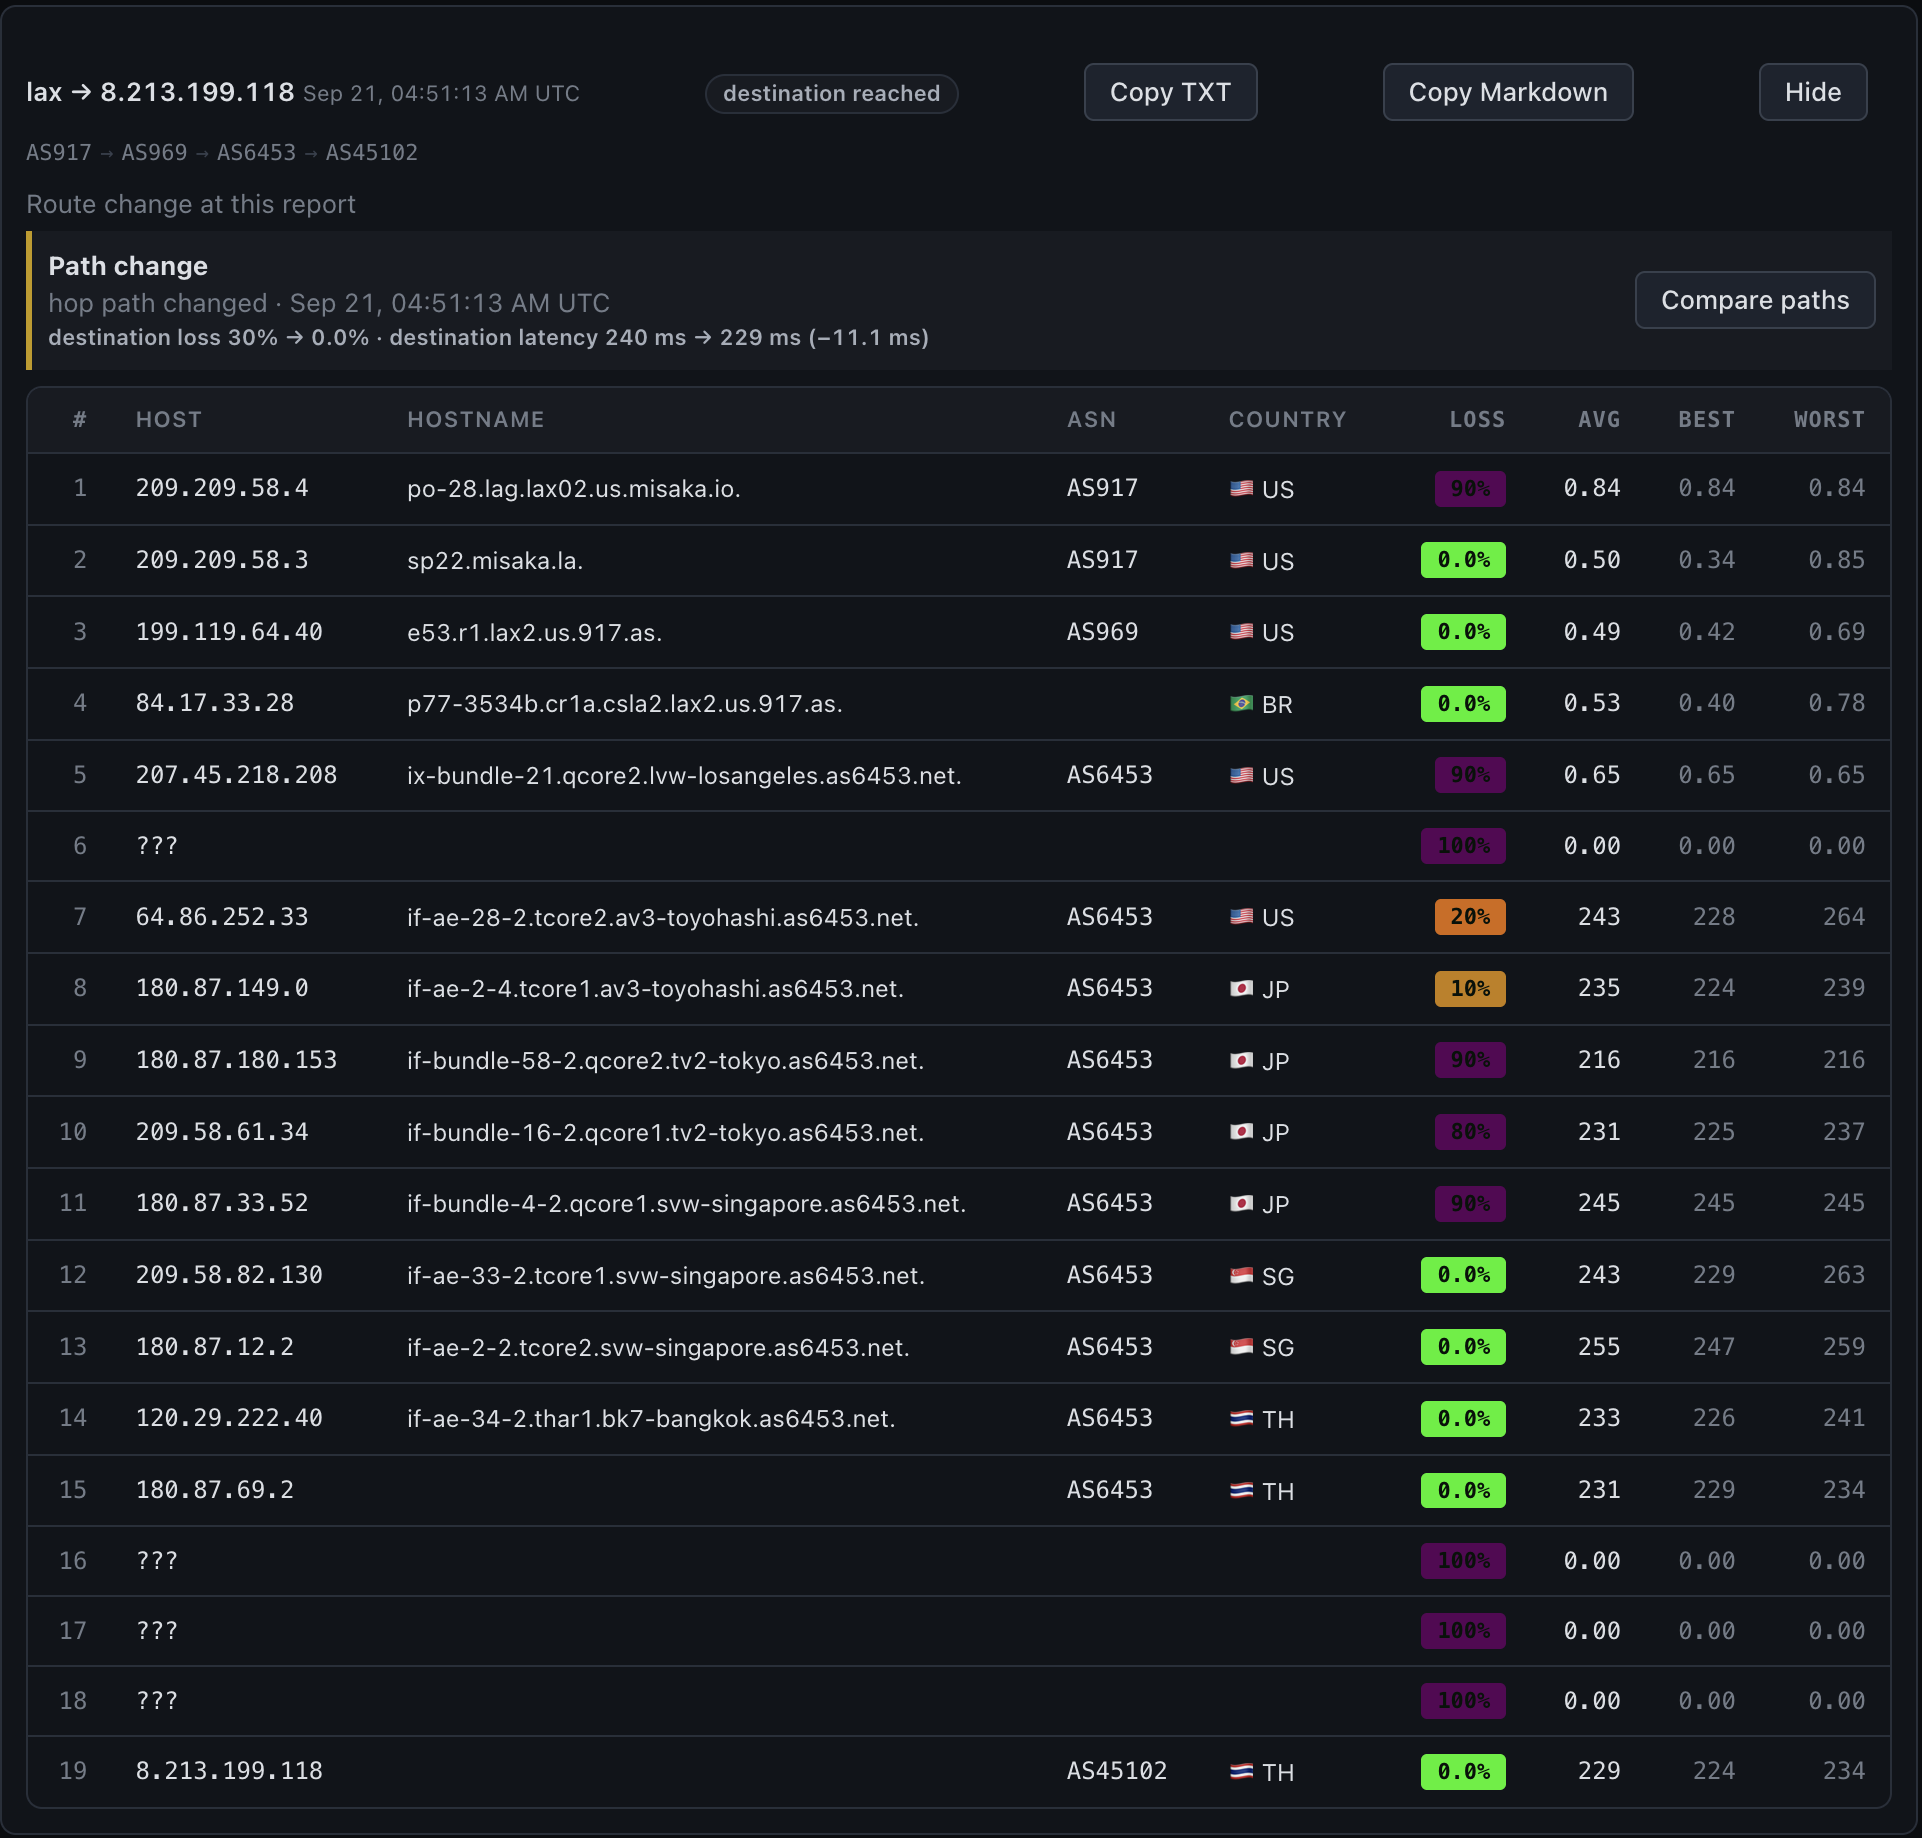
Go from “something feels slow” to evidence you can work with. Every latency and loss chart sits next to the routes your traffic actually took.
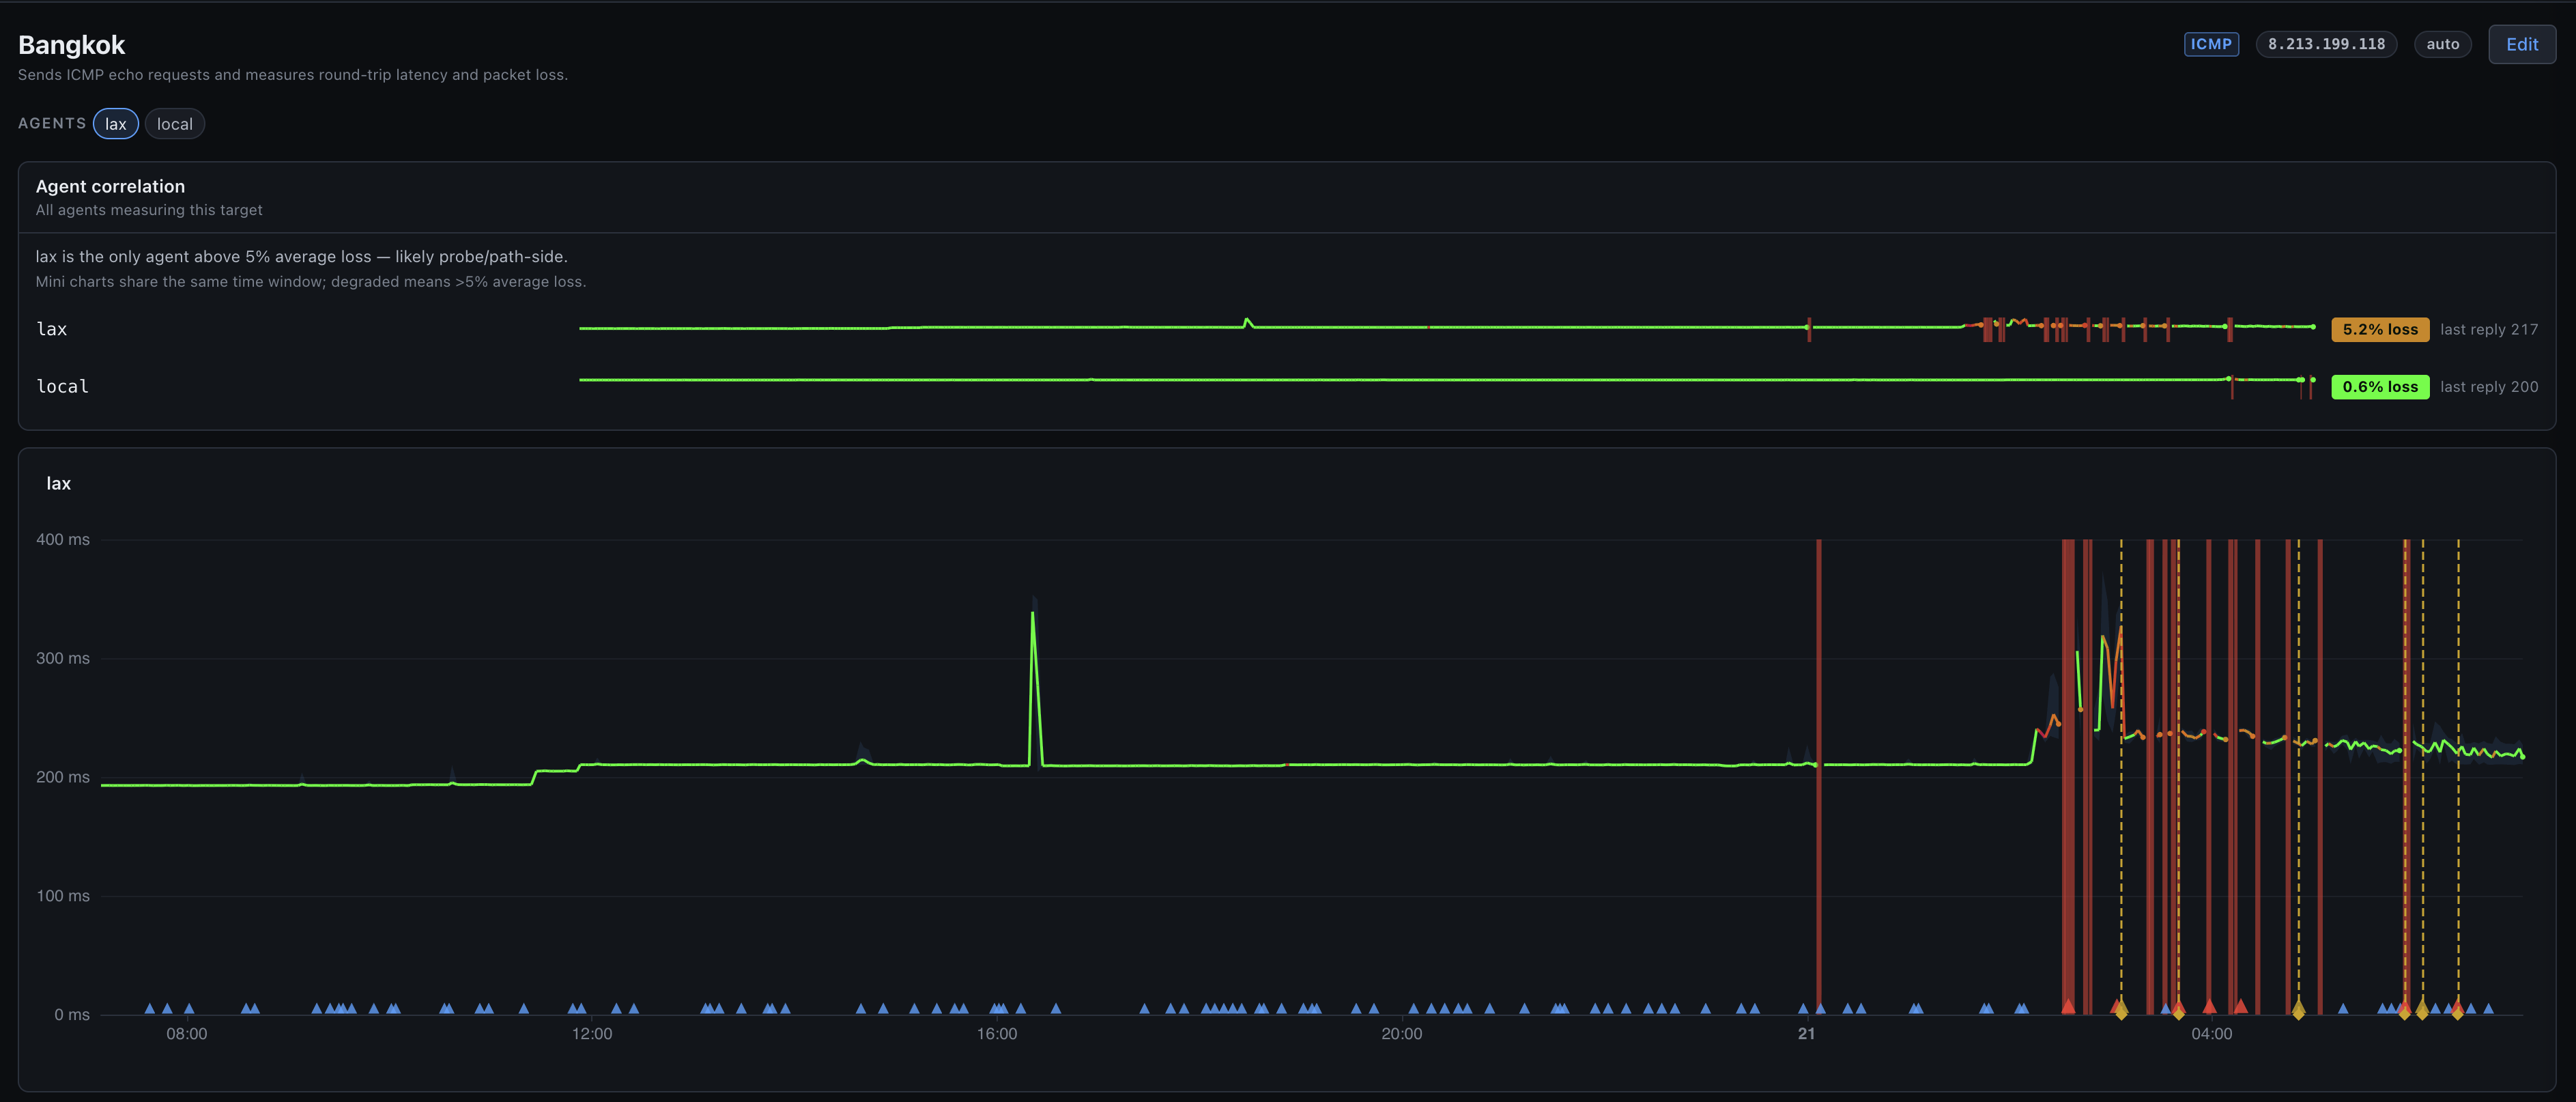
Track latency and packet loss over time, with the min/max and jitter context that a single average hides.
Open the route behind any point on the chart. Each hop resolves to its hostname, ASN and country.
Probe a target from several agents at once and compare what each vantage point sees.
Correlation & path changes
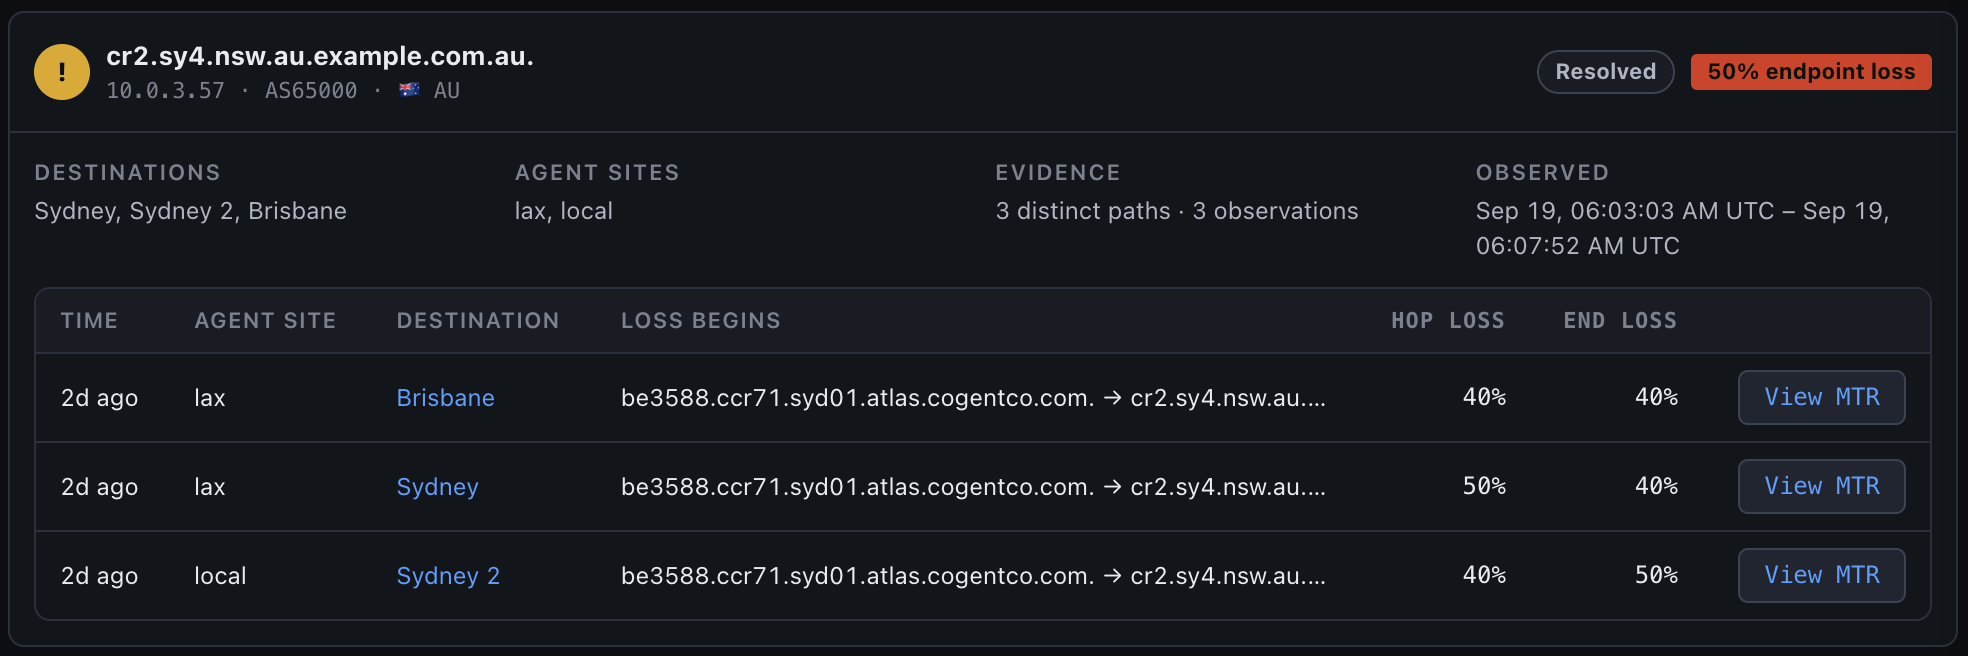
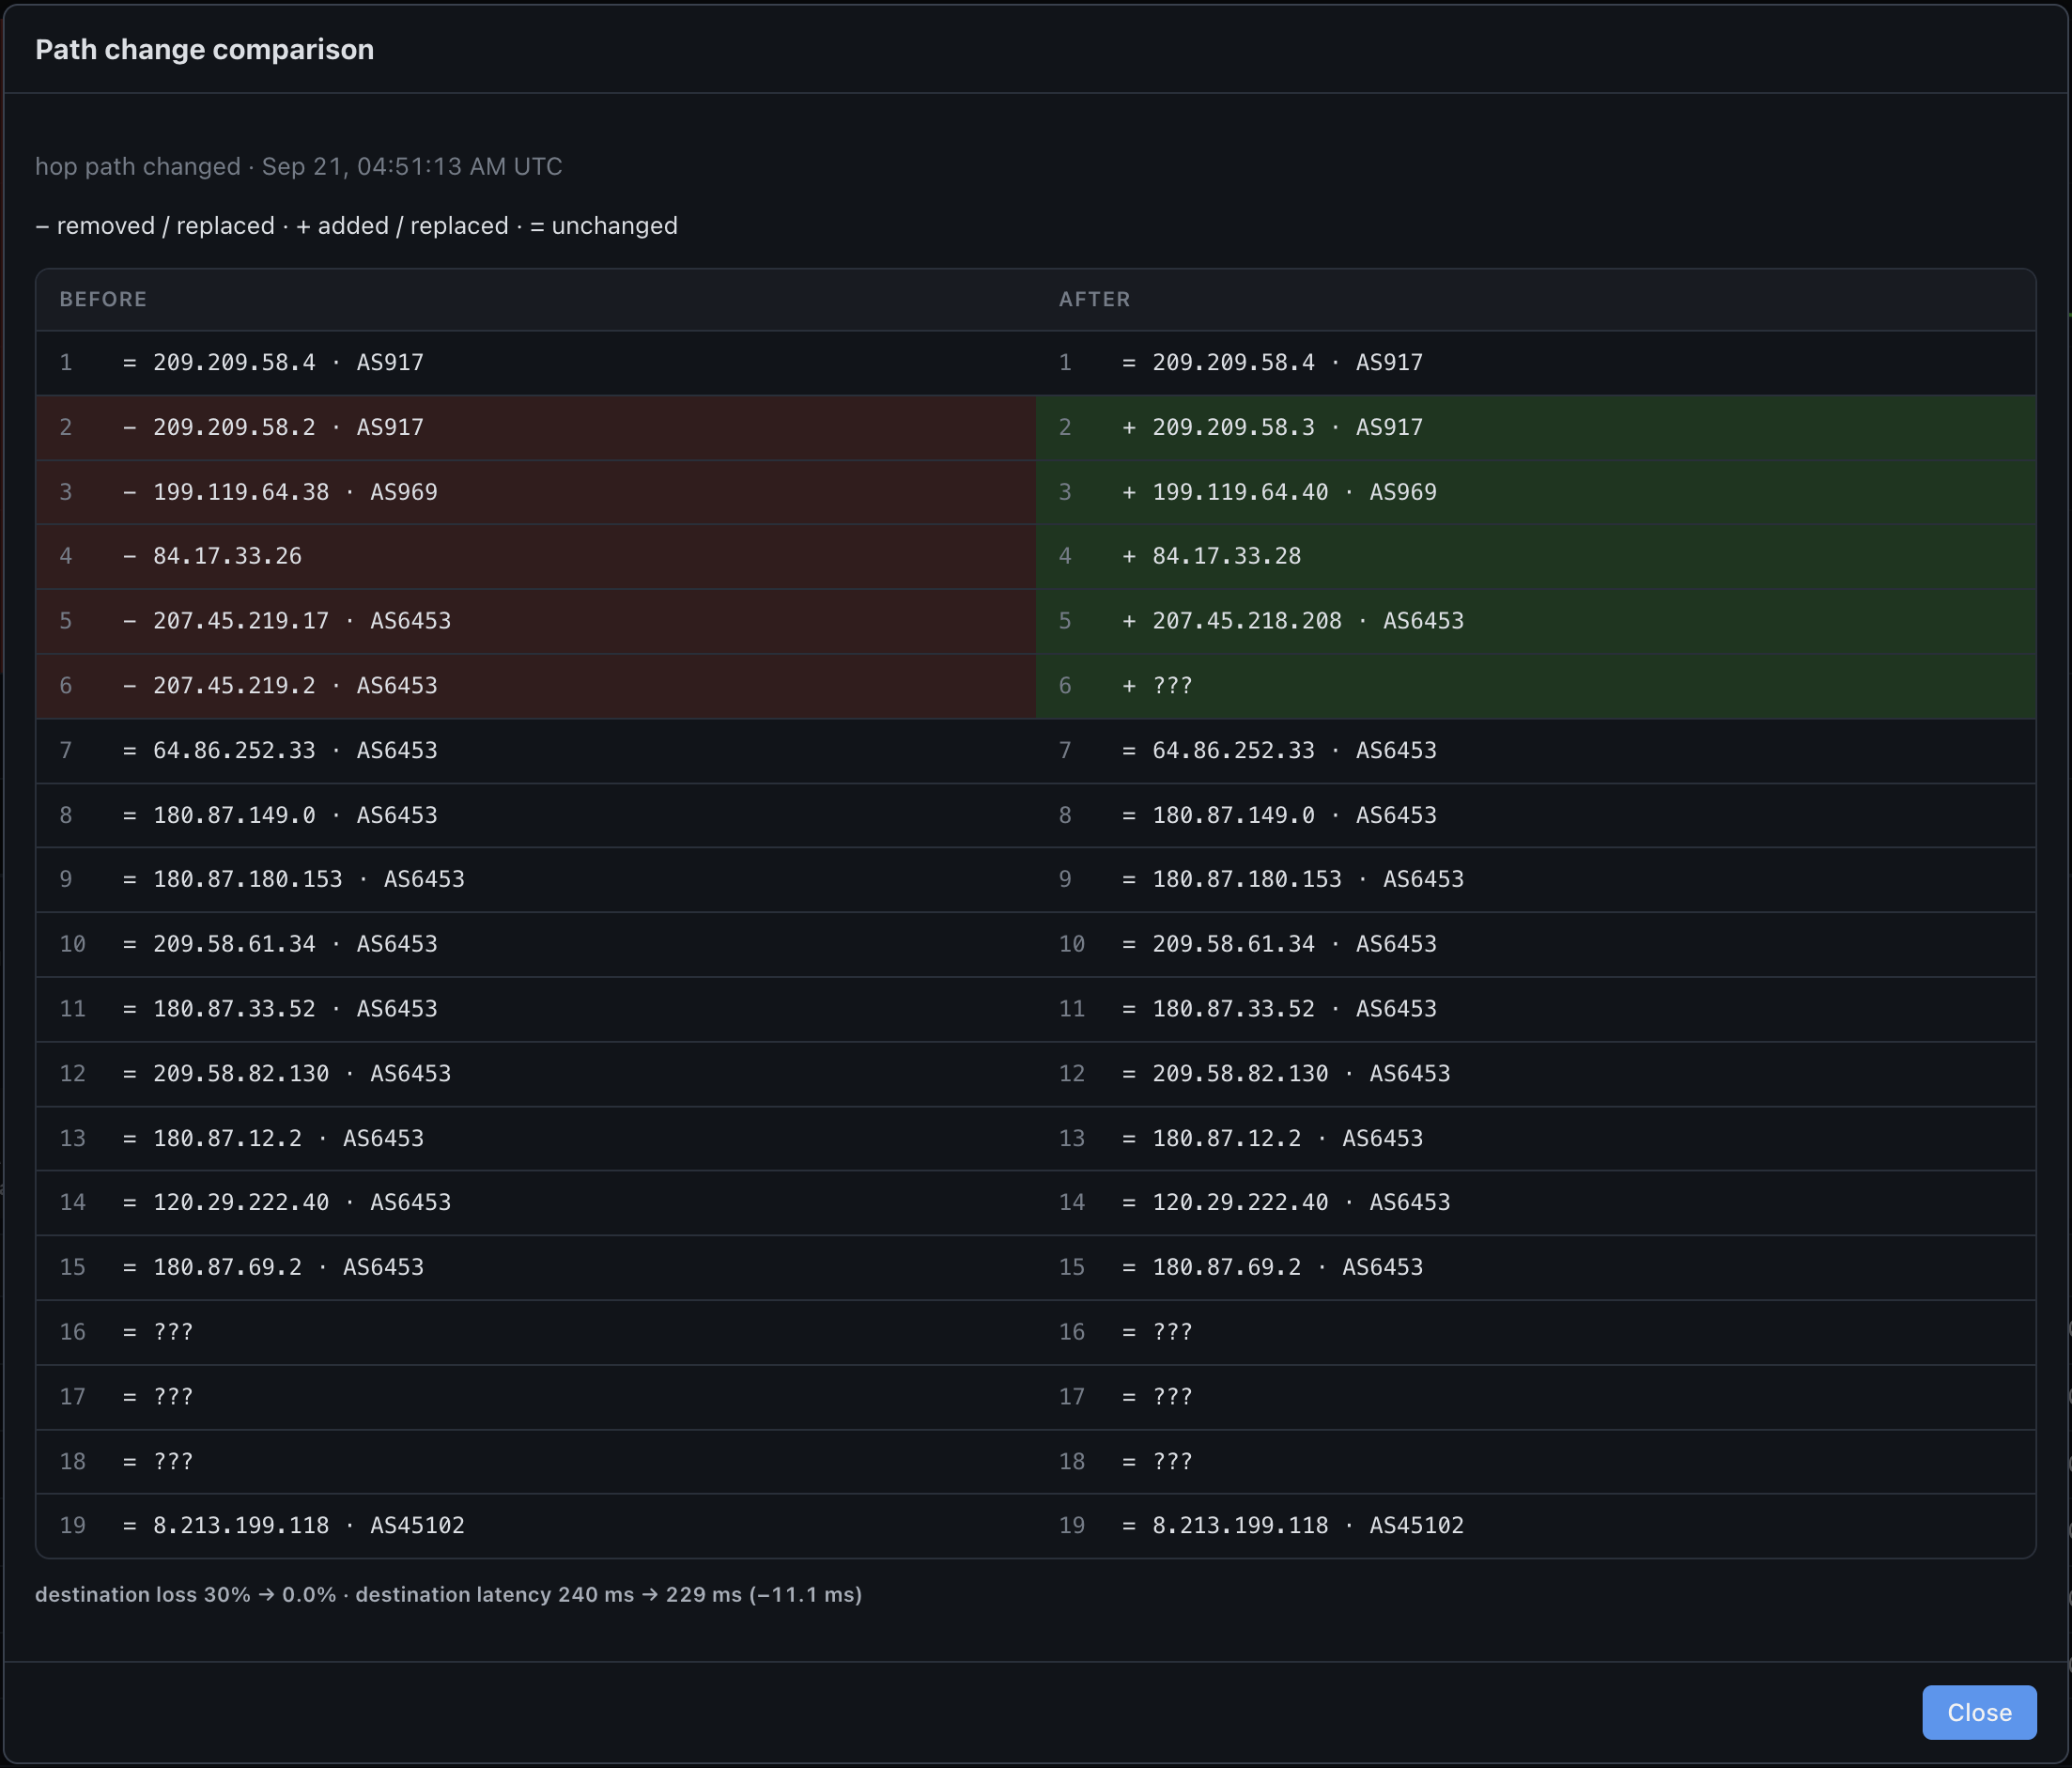
Observiant correlates loss across destinations and agent sites, then shows the traceroute that supports it. Compare the path before and after a route change to see exactly what moved.
Engineers get the detail to investigate. Everyone else gets a clear picture of what happened.
On-demand diagnostics
When a chart shows something odd, look at the path as it is now. Run ping and MTR from the agents you choose and watch the results side by side.
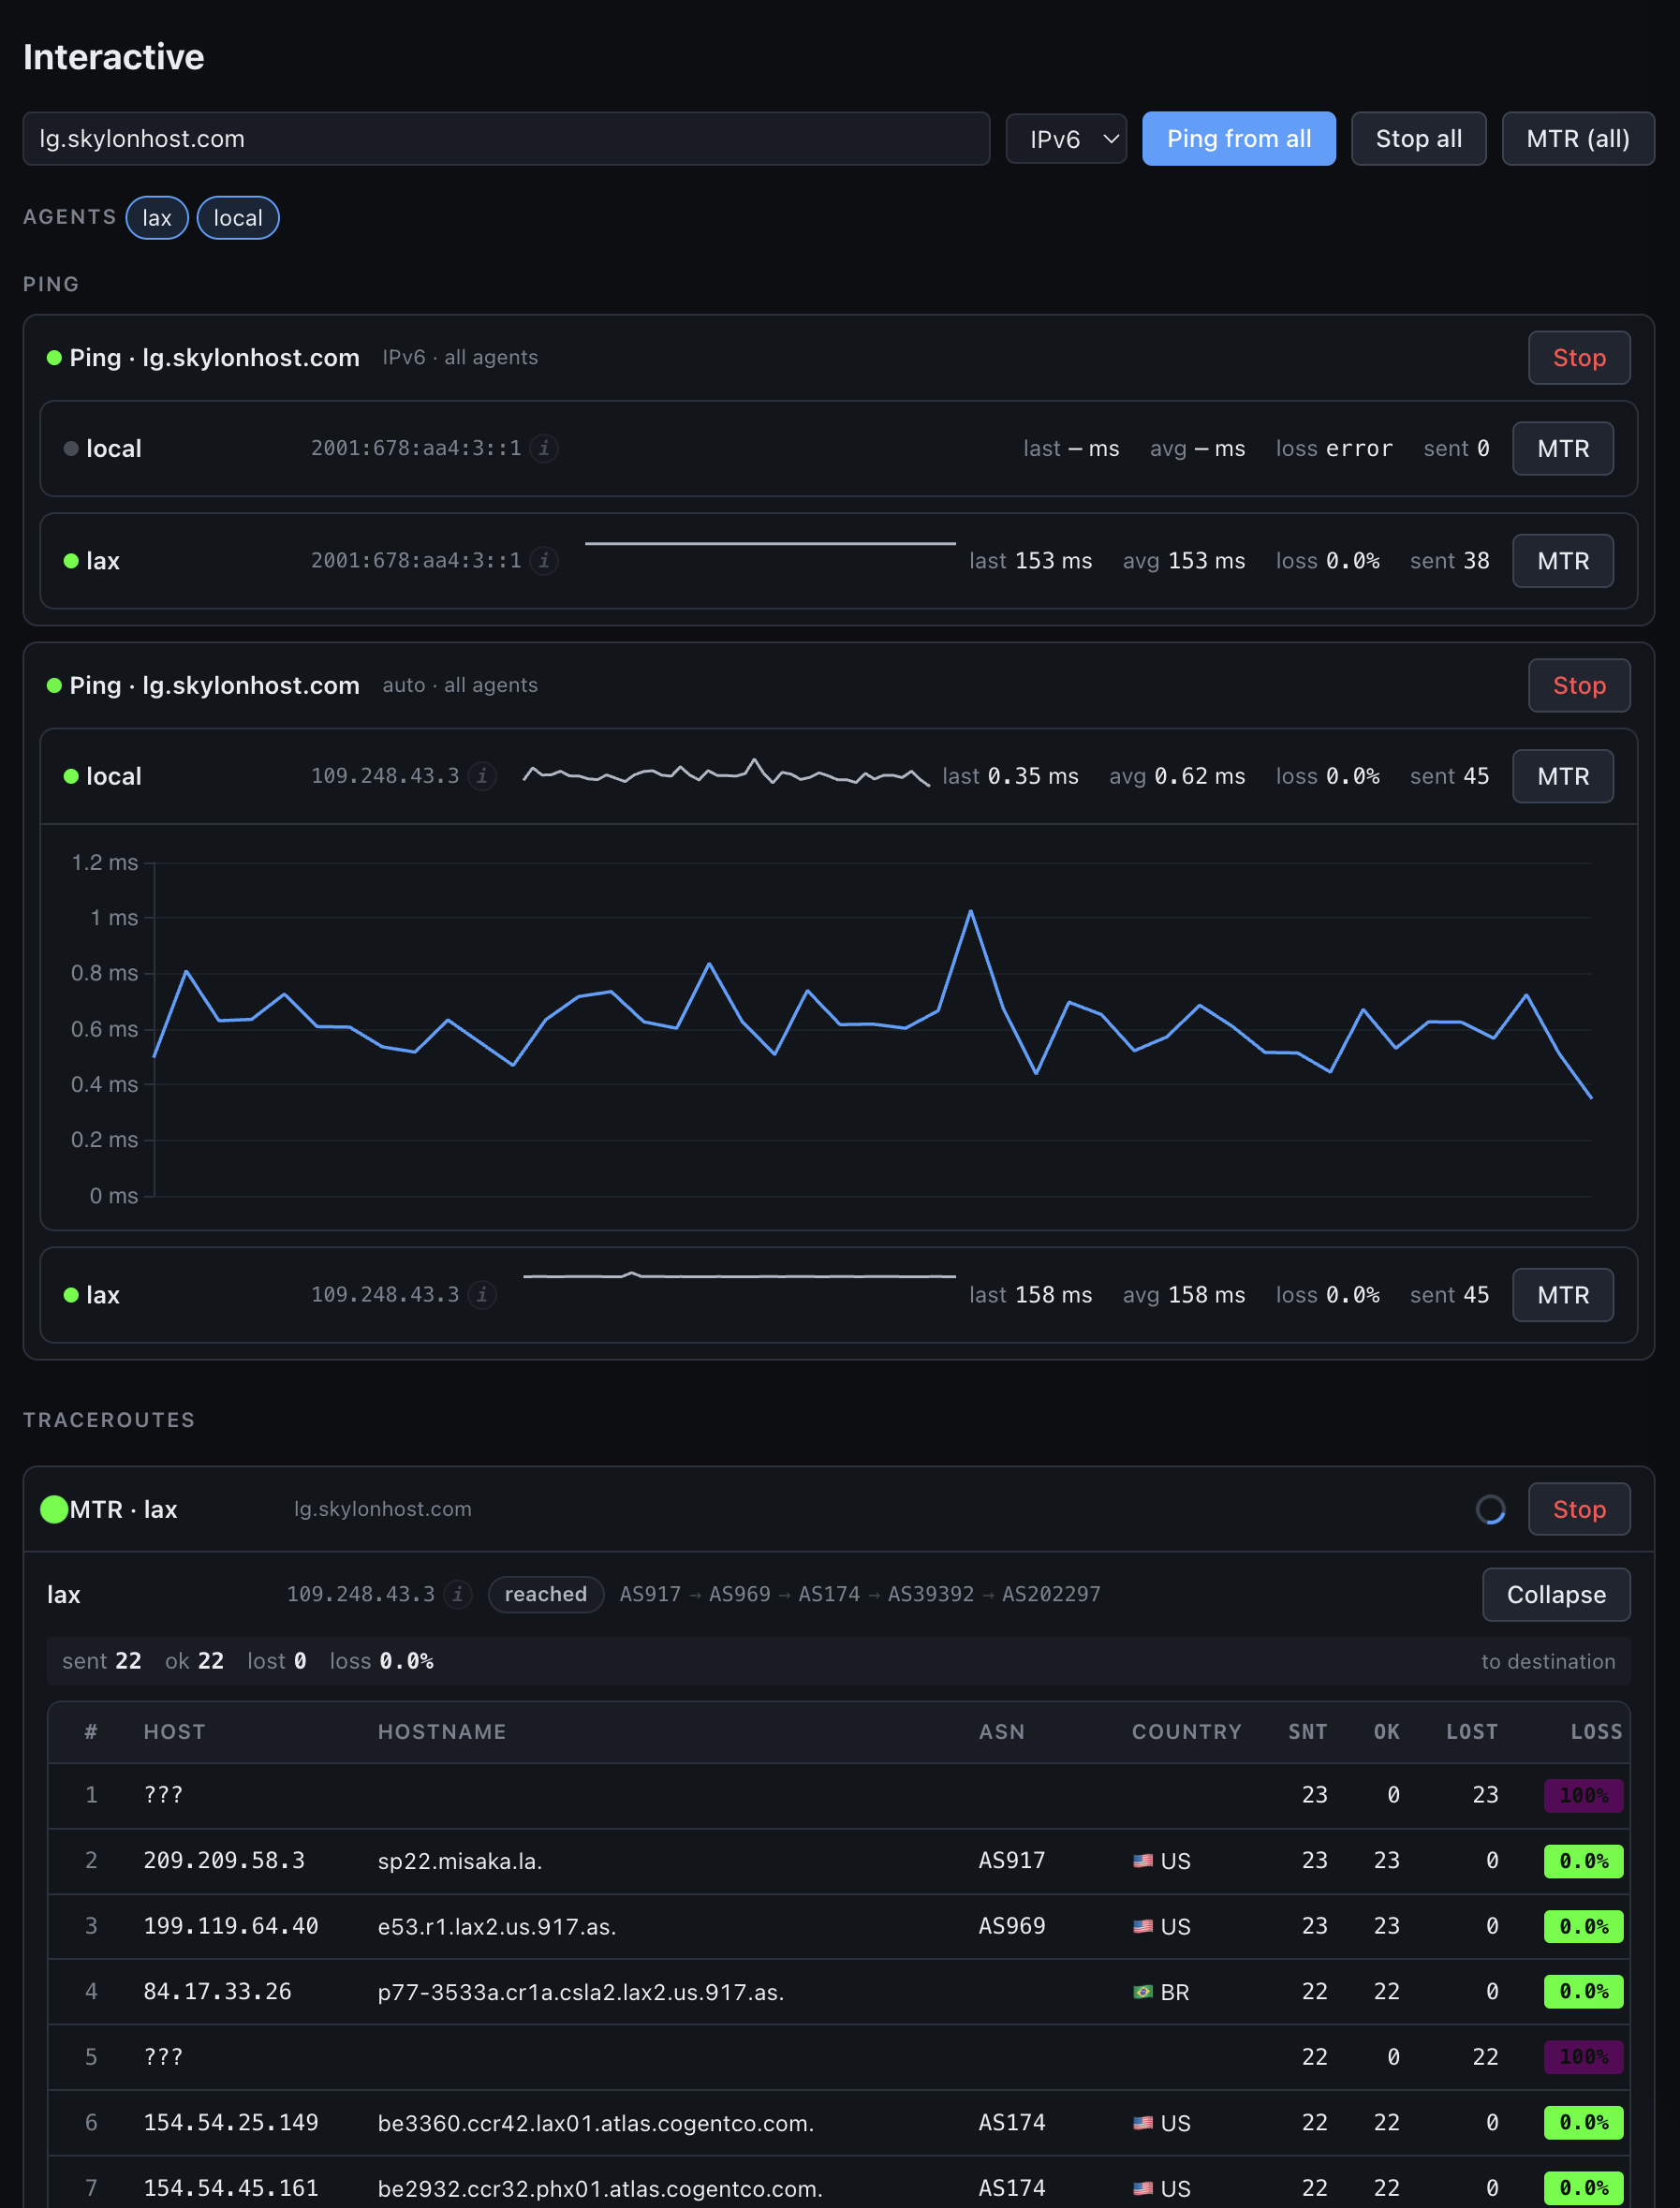
One network looks very different from two places. Combine locations operated by Observiant with agents on infrastructure you control.
System agents
Measurement locations run by Observiant give you an outside perspective. Choose from the locations included in your plan.
Browse monitoring locationsUser agents · bring your own
Install agents on your own servers, sites or private network, and measure alongside your system agents.
System agents and user agents have separate plan allowances.
Compare plan allowances